About the project
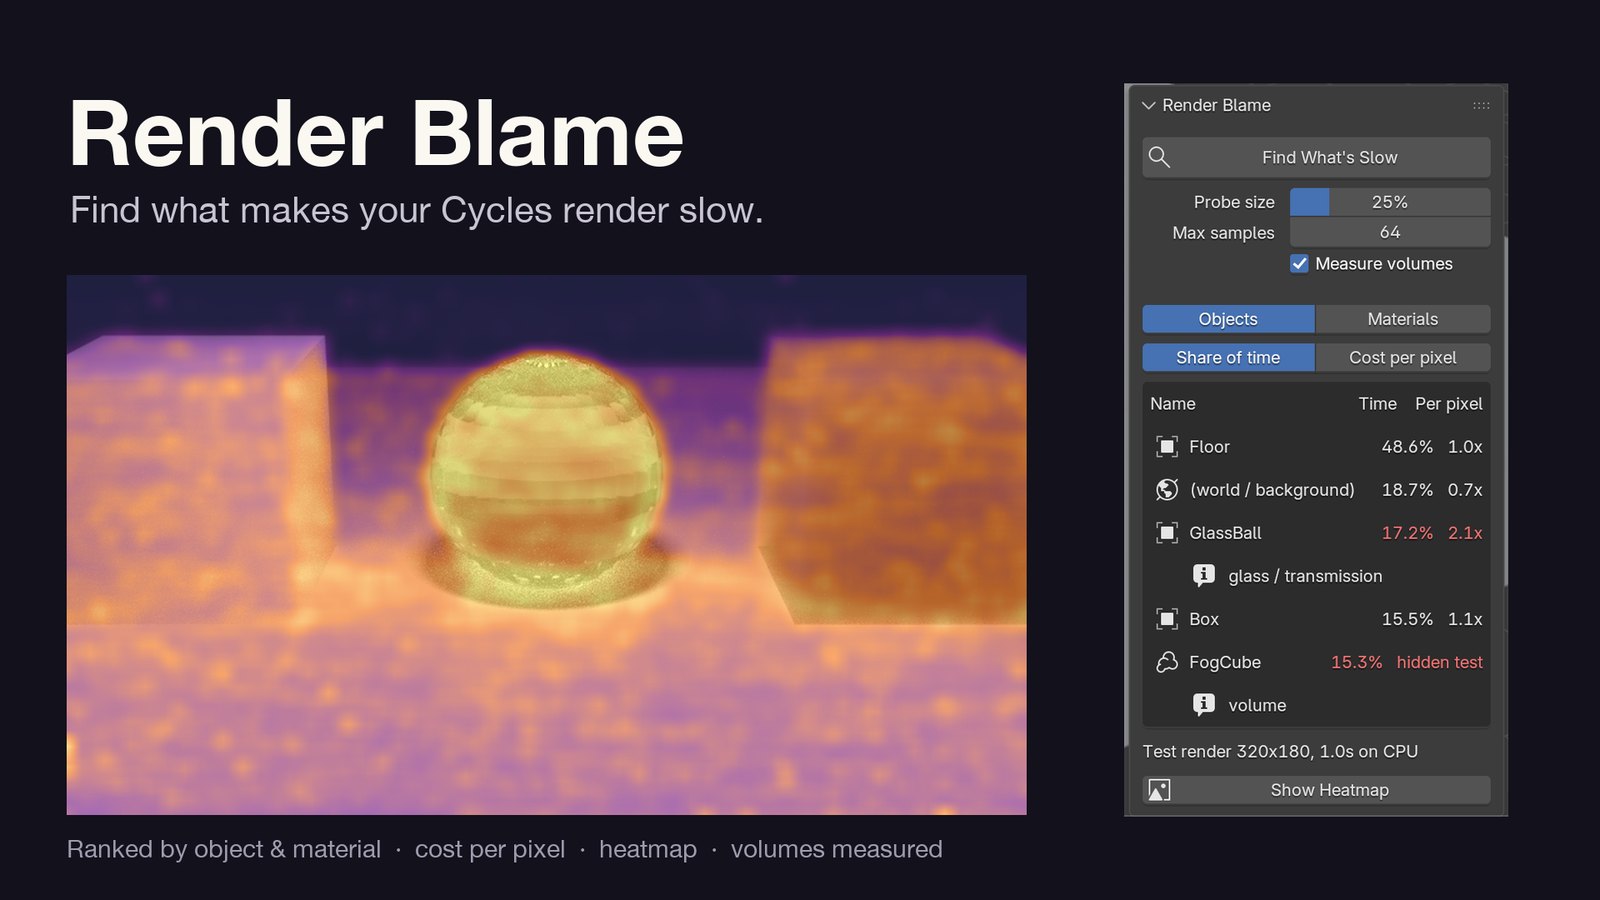
Blender tells you a frame took four minutes; it never tells you why. Render Blame does. One button saves a copy of the scene and renders it small in a background Blender, with Cycles’ per-pixel Render Time pass and Cryptomatte object and material IDs, then shares every pixel’s time between whatever covers it. You get two numbers for each object and material: its share of the whole render, and its cost per pixel against the average — the one that finds the culprit, because share mostly follows how big something is on screen. Volumes write no IDs, so it measures each one by hiding it and rendering again. Rows at 1.5× or more turn red with the likely reason (glass, subsurface, coat, hair, transparency, volume), a click selects the object, and a heatmap shows where the time went. The test render always runs on the CPU, because Cycles only writes the Render Time pass there. Before building it I searched the 2026 add-on market: profilers, validators and render-time estimators all exist, but nothing split Cycles shading time by object. I then tested it on five real Sketchfab models — a ship in a bottle, a crystal chandelier, a plant, a scanned statue and a living room — and checked every answer against the time actually saved by hiding each model or giving it a plain material. Model totals came within a few percent (the bottle: 25.0% predicted, 24.1% real). The test also caught three things the toy scene never could: objects seen through glass were being blamed for the glass, a chandelier’s glowing bulbs and mirror metal cost 19% almost entirely on other pixels, and imported models arrive as dozens of parts called Object_2. Version 0.1.1 fixes all three. Free and open source, submitted to Blender Extensions.